Background
A spiroplot as a system has two main components:
1. Some points p1, p2, …, which have coordinates. For nice figures we typically use three to eight points. Before the process starts, we need to give the points initial coordinates. The process will change the coordinates of the points.
2. A sequence of triplets consisting of two points and one angle. For example, this could be (p1, p2, 90); (p2, p3, 90). This is a sequence of two of these triplets. Points are specified by their identifier (like p1, p2, …) and not by coordinates.
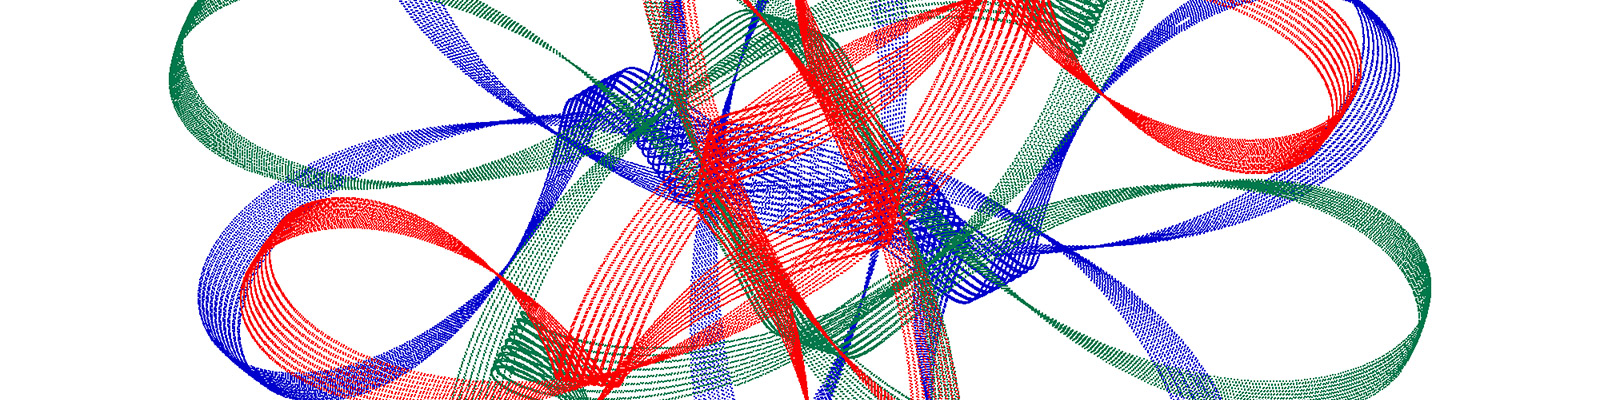
The execution of the process is simply performing the rotations specified by the triplets. For the triplet (p1, p2, 90), we take the current positions of p1 and p2, determine their midpoint, and then rotate both p1 and p2 around this midpoint over 90 degrees. So we get new positions of p1 and p2. When points land somewhere after a rotation, they plot a small colored dot on a canvas. Every rotation plots exactly two dots. When the process is run, we take the sequence of triplets and perform the rotations in order. So first (p1, p2, 90), and then (p2,p3, 90). When the sequence is completed, we start again at the front, so we rotate p1 and p2 again around their (new) midpoint over 90 degrees. And then p2 and p3 around their current midpoint. And then p1 and p2 again. And so on.
The Javascript app is essentially a user interface to specify the initial locations of the points and the sequence of triplets. It allows a choice of color, which colors to show, whether to plot the dots normal or thick, whether the run should be fast, and more. A built-in tutorial will help you on your way.
To get nice plots, try simple situations first. Do not use many points or many triplets. You are allowed to repeat a pair of points in a new triplet later in the sequence. You are also allowed to pause the run, change the color of a point (right-click on that point in the canvas), and continue the run by clicking START.
Publications:
Casper van Dommelen, Marc van Kreveld, and Jérôme Urhausen. Spiroplots: a New Discrete-time Dynamical System to Generate Curve Patterns. Proceedings of Bridges 2020: Mathematics, Art, Music, Architecture, Education, Culture.
Casper van Dommelen, Marc van Kreveld, and Jérôme Urhausen. The Spiroplot App (Media). Proceedings of CG Week 2020.